"How do you increase press brake productivity?" Answering this question is key to a fabricator's profitability. While many focus on simple fixes, true gains are found by systematically eliminating the hidden inefficiencies of scrap, downtime, and slow setups that quietly drain profits.
This guide offers a complete strategic framework. We will show you how to diagnose your true performance with OEE, then implement a powerful improvement model based on empowering people, optimizing machines, and refining processes. Finally, we'll explore the leap to automation, providing a clear path to multiply your output and secure a competitive edge.
I. Breaking the Efficiency Deadlock: Why Press Brake Productivity Is the Lifeline of Your Business
In the sheet metal processing industry, the roar of workshop machinery is often heard as the sound of prosperity. Yet beneath this busy facade lies a harsh truth: inefficiencies in production are silently eroding profits in many companies.
Among all the steps in the manufacturing chain, the press brake unit is frequently the critical bottleneck that determines overall efficiency and profitability. If your team still equates press brake productivity merely with “how many parts can be bent per hour,” you may be standing on the edge of a massive profit sinkhole. For a deeper look into how leading manufacturers overcome this, explore insights from ADH Machine Tool, a trusted name in advanced press brake solutions.
1.1 Beyond “Parts Per Hour”: Redefining Productivity’s True Impact on Profit
“Parts Per Hour” is an enticing yet misleading vanity metric. It reflects only the peak speed under ideal conditions, while masking three far more critical factors that ultimately determine profitability. Together, these form Overall Equipment Effectiveness (OEE)—the gold standard for measuring productivity.
- Availability: How much of your press brake’s time is actually spent producing, rather than standing idle, changing dies, programming, or waiting?
- Performance: When running, what percentage of its theoretical maximum speed does it achieve?
- Quality: What proportion of parts meet specifications the first time, without rework or scrap?
A more insightful measure is “Profit Contribution per Effective Bending Hour.” This KPI links OEE directly to financial outcomes, forcing us to ask: after accounting for all losses, how much tangible profit does each hour of effective operation generate?
Research shows that even a small percentage increase in OEE can drive profit growth far beyond expectations. You can learn more about how do you increase press brake productivity through advanced bending accuracy techniques and data-driven methods.
1.2 Uncovering Hidden Costs: How Scrap, Downtime, and Missed Orders Devour Your Profits
A low OEE acts like a stealth assassin on your margins, eroding profits in several ways:
- The True Cost of Scrap: A scrapped part costs far more than just the material. Its real cost is the sum of material expense + machine time already invested + operator wages + energy consumption. Worse yet, it consumes time that could have been used to produce good parts, causing a double loss.
- The Domino Effect of Downtime: Unplanned downtime is like cardiac arrest for your production flow. Its cost goes far beyond idle operator wages. It includes:
- Direct Losses: Fixed overheads such as machine depreciation and facility rent continue regardless.
- Opportunity Cost: The value and profit that could have been created during downtime are lost forever.
- Downstream Bottlenecks: Welding, assembly, and other subsequent processes grind to a halt, plunging the production schedule into chaos.
- Management Overhead: Engineers and managers must spend significant time diagnosing and resolving the issue.
- The Price of Missed Orders: This is the most damaging blow. When poor productivity leads to repeated delivery delays or inconsistent quality, you lose not only the immediate order but also the customer’s trust and future business. In a fiercely competitive market, reputational damage is often irreversible.
For more actionable strategies to prevent these losses, check out how do you increase press brake productivity for practical bending tips and workflow optimization.
1.3 From Diagnosis to Action: How This Guide Takes You from Bottleneck Analysis to Peak Performance
Recognizing the seriousness of the problem is the first step; finding the solution is even more important. This guide acts as your “productivity physician,” equipping you with a complete framework for diagnosis, analysis, and optimization—transforming the broad question of “how to improve press brake productivity” into a clear, actionable blueprint.
In the chapters ahead, we will systematically:
- Diagnose Precisely: Show you how to build a KPI-based health check system to pinpoint productivity bottlenecks with accuracy.
- Enhance Synergy: Provide dozens of immediately applicable, field-tested tips across people, machines, and processes to boost operational efficiency.
- Achieve Strategic Leaps: Explore cutting-edge technologies such as offline programming and robotic automation, revealing their true ROI and implementation pathways.
- Avoid Pitfalls: Analyze common cognitive biases and decision traps during transformation to ensure your improvement plan is successfully implemented.
Now, let’s embark on the journey from identifying efficiency bottlenecks to reaching peak performance—transforming your press brake unit from a cost center into a powerful profit engine.

II. Precision Diagnosis: Building a KPI-Based Productivity Health Check System
In Chapter 1, we revealed how low productivity acts as a hidden killer of profits. Now we shift from “why” to “how.” To improve any system, you must first measure it accurately. This chapter offers diagnostic tools akin to precision medical instruments for your production line, enabling you to quantify the health of your press brake unit and pinpoint exactly where the problems lie.
2.1 Core Metric—OEE (Overall Equipment Effectiveness): How “Busy” Is Your Press Brake, Really?
If you could track only one metric to measure press brake productivity, it should be Overall Equipment Effectiveness (OEE). OEE is the gold standard in manufacturing, ruthlessly exposing how much of your scheduled production time is actually spent making products of full value. A machine that appears busy can still have shockingly low OEE.
2.1.1 The Components of OEE: Availability, Performance, Quality
OEE is calculated by multiplying three key percentages: OEE = Availability × Performance × Quality.
- Availability: Measures the loss of “time.” It answers: “Of the scheduled production time, how much time did the machine actually run?”
- Formula:
Availability = Actual Operating Time / Scheduled Production Time - Expert Insight: “Scheduled production time” means total shift length minus planned breaks (such as lunch). “Actual operating time” is calculated by subtracting all downtime from scheduled time—not just unexpected breakdowns, but also planned activities such as die changes, programming, and waiting for materials. Many managers focus only on unplanned downtime, overlooking planned activities like changeovers, which are often the largest hidden opportunities for improving availability.
- Formula:
- Performance: Measures the loss of “speed.” It answers: “When running, how fast is the machine operating?”
- Formula:
Performance = (Ideal Cycle Time × Total Output) / Actual Operating Time
- Formula:
- Expert Insight: The "ideal cycle time" is the heart of this formula. It must never be based on an “average” or “experienced” time—instead, it should reflect the theoretical fastest machining time achievable for that part on that specific machine. This figure should come from the equipment manufacturer’s specifications or precise engineering calculations. Using an inflated (slower) “ideal” time is one of the most common ways to game OEE calculations, masking losses caused by insufficient operator skill, suboptimal machine settings, or brief unplanned pauses.
- Quality Rate: Measures the loss in “output.” It answers the question: “Of all parts produced, how many meet quality standards without requiring rework?”
- Formula:
Quality Rate = Number of Good Units / Total Units Produced - This is a relatively straightforward metric that reflects your ability to control quality at the source.
2.1.2 How to Calculate and Interpret OEE for Your Press Brake
Let’s walk through a real-world example of calculating OEE for an 8-hour shift:
| Parameter | Time/Quantity | Calculation Notes |
|---|---|---|
| Total Shift Length | 480 minutes | 8 hours |
| Planned Breaks | 60 minutes | Lunch and rest breaks |
| Planned Production Time (A) | 420 minutes | 480 - 60 |
| Downtime | Tool change (35 min) + unexpected breakdown (12 min) = 47 minutes | |
| Actual Run Time (B) | 373 minutes | 420 - 47 |
| Ideal Cycle Time | 15 sec/unit | Theoretical fastest speed from engineering calculations |
| Total Output | 1,300 units | |
| Defective Units | 26 units | |
| Good Units (C) | 1,274 units | 1,300 - 26 |
Now, let’s calculate the three components of OEE:
- Availability =
(B) / (A)=373 minutes / 420 minutes= 88.8% - Performance =
(15 sec × 1,300 units) / (373 minutes × 60 sec)=19,500 sec / 22,380 sec= 87.1% - Quality =
(C) / Total Output=1,274 units / 1,300 units= 98.0%
Final OEE = 88.8% × 87.1% × 98.0% = 75.8%
Interpretation: What does an OEE of 75.8% signify? World-class OEE is typically above 85%, around 60% is average, and 40% signals significant improvement potential. The figure itself is less important than what it reveals about where losses occur. In this case, availability (88.8%) and performance (87.1%) are the main weaknesses. This suggests that, more than quality issues, the most effective ways to boost this press brake cell’s profitability are reducing changeover and unplanned downtime and improving actual run speed.
2.2 Four Essential KPIs You Must Track
OEE is like the overall score on a health check, while the four KPIs below are the detailed lab results. They dig deeper into the root causes of performance issues.
Average Setup Time
- Definition: The total time from producing the last good unit of the previous batch to producing the first good unit of the next batch.
- Why It Matters: In today’s era of high product variety and small batch sizes, changeovers are the number one killer of availability. Tracking and steadily reducing this time is the most direct way to unlock extra capacity.
First Pass Yield (FPY)
- Definition: The percentage of parts produced right the first time, without any form of rework.
- Why It Matters: FPY is a stricter measure than the quality component of OEE. It exposes the “hidden factory”—the people, time, and resources dedicated to rework. A low FPY often points to unstable processes, worn tooling, inconsistent materials, or gaps in operator skills.
Cost Per Bend
- Definition:
(Machine hourly cost allocation + Operator hourly wage) / Actual number of good bends produced per hour. - Why It Matters: This is the ultimate metric linking operational efficiency directly to financial performance. It enables more accurate quoting and evaluates the real ROI of new equipment, tooling, or automation in the most tangible financial terms. For example, it can answer: “Can this more expensive electric press brake, with its higher speed and quality, reduce my cost per bend from $0.50 to $0.30?”
Rework/Scrap Pareto Analysis
- Definition: Goes beyond tracking scrap counts by systematically recording and categorizing every defect (e.g., incorrect angle, dimensional deviation, surface scratches, programming errors). A Pareto chart is then used to identify the 20% of causes responsible for 80% of quality losses.
- Why It Matters: This prevents your team from wasting resources on minor issues and instead focuses efforts on eliminating the biggest problems. The resulting analysis becomes your actionable roadmap for the next phase of quality improvement.

III. The Three Pillars of Productivity: A Synergy Model of People, Machines, and Processes
In Chapter 2, we learned how to use OEE and key KPIs to accurately diagnose the health of your productivity. Diagnosis is the first step—now we move into the treatment and strengthening phase. Boosting productivity isn’t about a single “magic bullet,” but rather a systematic approach that integrates people, equipment, and processes. We build this on three pillars: People Empowerment, Machines & Tools, and Processes & Management. Like a tightly woven net, these elements are interdependent—any weak strand limits the height of overall improvement.
3.1 Pillar One: People Empowerment – Evolving from Operator to Process Technician
A common misconception in the age of automation is that “machines matter more than people.” In press brake operations, however, a fully empowered employee can create value far beyond what a hardware upgrade alone can deliver. The goal is to help your press brake operators transform into “process technicians”—not just executors, but owners of the process, guardians of quality, and creators of efficiency.
3.1.1 Skills Matrix and Cross-Training: Building a Flexible, High-Performance Team
- Building a Skills Matrix: This isn’t a personnel record—it’s a strategic capability map for your team. Create a table with operators along the horizontal axis and key competencies along the vertical axis (such as programming specific CNC systems, complex die installation, stainless steel springback compensation, safety protocols, etc.). By conducting regular assessments and using color codes (e.g., expert, proficient, novice, untrained), you gain a clear picture of your team’s overall skill landscape, pinpoint single points of failure, and identify training priorities.
- Implementing Cross-Training: The skills matrix serves as your cross-training playbook. It enables you to strategically pair “experts” with “novices,” ensuring at least 2–3 team members master each critical skill. This not only prepares you for unexpected absences but, more importantly, sparks fresh ideas as different perspectives meet during training. Such exchanges often lead to improved, more efficient methods—feeding valuable enhancements back into your SOPs.
3.1.2 Standard Operating Procedures (SOP): Capturing Best Practices for Consistent Output
Expert Insight: A great SOP is not a dusty, text-heavy manual locked away in a cabinet. It should be a living, visual guide, readily accessible right at the machine.
- Visualization: Use high-resolution images and short videos (linked via QR codes) to illustrate critical steps, such as the correct die installation orientation, specific handling techniques for special workpieces, and key CNC parameter screens. A single image can convey information faster and more accurately than pages of text.
- Dynamic Updates: Host SOPs on shop-floor tablets or industrial terminals. When any employee discovers a safer or faster method, provide a channel for suggesting updates. SOPs should embody collective team wisdom rather than top-down, static instructions—transforming the intuition and “feel” of top operators into teachable, repeatable processes.
3.1.3 Advanced Bending Skills Training: Optimizing Sequences, Minimizing Flips, Multi-Bends in One
Empowerment starts with skill advancement—helping operators move from simply “using” a machine to truly mastering it. Beyond the basics, advanced training can deliver significant efficiency gains, directly boosting the “Performance” metric within OEE.
- Optimized Bend Sequences: Learn to plan the most efficient bending order via offline programming software or operator experience, avoiding interference between the workpiece and the machine’s uprights or backgauge. This reduces unnecessary flipping and rotation—every extra movement is lost time.
- Staged Bending: Install 2–3 different die sets along the press brake’s full length. The operator can simply shift the workpiece left or right to perform multiple bends in one clamping. This “trading space for time” approach can be transformative for complex parts.
- Bump Bending for Large Radii: Use a series of small, incremental bends to create a smooth large radius. This method avoids the need for costly specialized radius dies and showcases the operator’s craftsmanship.
3.1.4 Safety as Efficiency: Reducing Downtime by Enhancing Safety
Safety and efficiency are not opposites—they reinforce each other. Every accident or near miss represents costly unplanned downtime, directly eroding the “Availability” component of OEE.
- Treat Safety as a Productivity Metric: Any downtime caused by unsafe practices or conditions should be logged as availability loss and factored into KPI evaluations.
- Improve Ergonomics: Provide height-adjustable front support arms and lifting aids for heavy workpieces to significantly reduce operator fatigue. Less fatigue means fewer errors and injuries, allowing operators to focus on quality and efficiency rather than battling exhaustion or risk.
3.2 Pillar Two: Machines & Tools – Unlocking Full Equipment and Die Potential
If people are the software, machines and tools are the hardware. Only by fully unleashing hardware capabilities can you maximize the value of your human capital.
3.2.1 Die Strategy Revolution: Immediate Efficiency Gains
Expert Insight: The fastest and highest ROI route to boosting bending efficiency often isn’t buying a new machine—it’s radically overhauling your die management and usage strategy. Learn more about how do you increase press brake productivity by optimizing die setups and tooling strategies. The real battleground is your die cabinet.
- Standardization & Interchangeability: Wherever possible, adopt a high-precision universal die system (such as European- or Wilson-style segmented precision-ground dies) across all press brakes. This allows any die set to work on any machine, enabling seamless changeovers, greatly increasing production flexibility, and eliminating the chaos of dies matched only to specific machines.
- The “Kitting” Concept: While the current job is still running, prepare all resources for the next job—programs, drawings, segmented dies arranged in sequence, calipers, angle gauges—on a dedicated tooling cart. When changeover begins, everything is within arm’s reach, eliminating wasted time searching for tools.
- Quick-Clamping Systems: Invest in hydraulic or pneumatic quick-clamp systems to cut manual bolt tightening time from several minutes to mere seconds with the push of a button—directly and effectively reducing changeover times.
3.2.2 Smart Feature Upgrades: Auto-Calibration to Eliminate Trial Scrap
Modern press brakes offer an array of intelligent features designed to eliminate trial-and-error and improve First Pass Yield (FPY). These tools safeguard quality and performance against material variations and environmental changes.
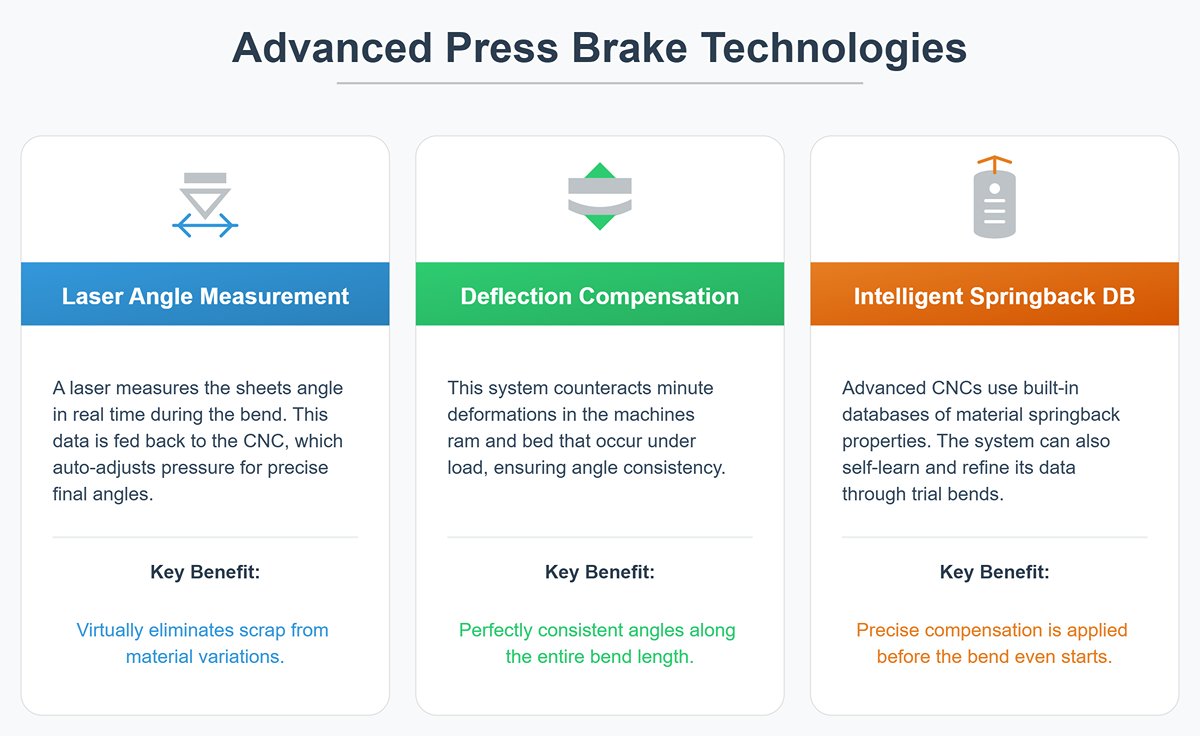
- Laser Angle Measurement Systems: During bending, a laser beam measures the sheet’s angle in real time, feeding data back to the CNC system, which automatically adjusts pressure to achieve precise final angles. This virtually eliminates scrap caused by variations in material thickness or hardness.
- Automatic Deflection Compensation: Whether hydraulic or mechanical, these systems counteract minute deformations in the ram and bed under load, ensuring perfectly consistent angles along the entire bend length—a critical function for long workpieces.
- Intelligent Springback Databases: Advanced CNC systems include built-in databases covering springback for various materials and thicknesses, and can even self-learn and refine through trial bends. This means the program already includes precise springback compensation before bending begins.
3.3 Pillar Three: Process & Management – Building a Lean, Efficient Workflow
Even with exceptional people and top-tier equipment, you need an efficient process to integrate them seamlessly, creating a multiplier effect.
3.3.1 Applying SMED: Reducing Changeover from Hours to Minutes
The core concept of Single-Minute Exchange of Die (SMED) is to rigorously separate changeover tasks into “internal” and “external” operations.
- Internal Operations: Tasks that require machine downtime, such as removing and installing dies.
- External Tasks: Operations that can be prepared in advance while the machine is still running.
- Three-Step Optimization Process:
- Identify and Separate: Thoroughly analyze the current die change process to determine which tasks are internal and which are external.
- Externalization: Convert as many internal tasks as possible into external ones. The “tool cart” concept mentioned earlier is a prime example—locating and preparing dies, verifying drawings, and readying inspection tools can all be completed while the machine continues operating.
- Internal Optimization: For tasks that must be done during downtime, focus on extreme time reduction. Examples include replacing manual bolts with quick-clamping systems, or designing all dies to a uniform height to eliminate the need for rear gauge height adjustments.
3.3.2 Intelligent Scheduling and Workflow Optimization
- Group Scheduling (Group Technology): Break away from the inefficient practice of scheduling solely by order urgency. Using MES or APS systems, group jobs with similar material, comparable thickness, and compatible tooling for continuous production. This “group technology” approach minimizes both the frequency and magnitude of die changes, delivering exponential efficiency gains.
- Optimized Shop Layout: Arrange raw material storage, laser/punch presses, press brakes, welding zones, and finished goods areas to ensure the shortest, smoothest material flow. Waiting and transport between operations are hidden productivity killers in manufacturing.
3.3.3 Data-Driven Decision-Making: Using Real-Time Monitoring to Identify and Resolve Bottlenecks
In Chapter 2 we built a KPI framework; here, we bring that data to life—moving from after-the-fact reporting to real-time operational control.
- Real-Time OEE Display Panels: Install prominent screens in the workshop showing each press brake’s OEE, availability, performance, and quality rates in real time. This isn’t just for management—it’s about empowering operators. When they can instantly see their performance and pinpoint bottlenecks (such as unusual downtime), they are more likely to take ownership and actively improve.
- Rapid Bottleneck Response Protocol: When monitoring systems detect persistently low performance or downtime beyond set thresholds for any machine, automatically trigger a rapid response—team leaders and process engineers must be on-site within five minutes to work with the operator to determine whether the issue stems from programming, tooling, or technique, and resolve it on the spot. This is true data-driven lean management: stopping problems before they escalate.
IV. Advanced Automation: A Strategic Leap Toward Multiplying Productivity
In the first three chapters, we established a solid understanding framework, learned precise diagnostic methods, and mastered systematic optimization strategies based on people, machines, and processes—like fine-tuning a race car to peak performance.
Now it’s time to install the most powerful engine: automation. This is not simply replacing manual labor with machines, but a profound strategic transformation designed to elevate efficiency, consistency, and profitability to a new level—shifting from incremental gains to exponential growth.
4.1 Offline Programming (OLP): Minimizing Non-Production Time
If SMED maximizes “external tasks” in die changeovers, Offline Programming (OLP) does the same for the most time-consuming, experience-dependent stage of production preparation—programming and trial bending—almost entirely externalizing it. It’s a revolutionary tool that eliminates idle machine time at the source, maximizing OEE availability.
4.1.1 How It Works: Moving Programming from the Shop Floor to the Office
The essence of OLP is freeing programming work from the noisy shop floor—where it consumes valuable machine time—and relocating it to a quiet office, where engineers or technicians can work on powerful computers.
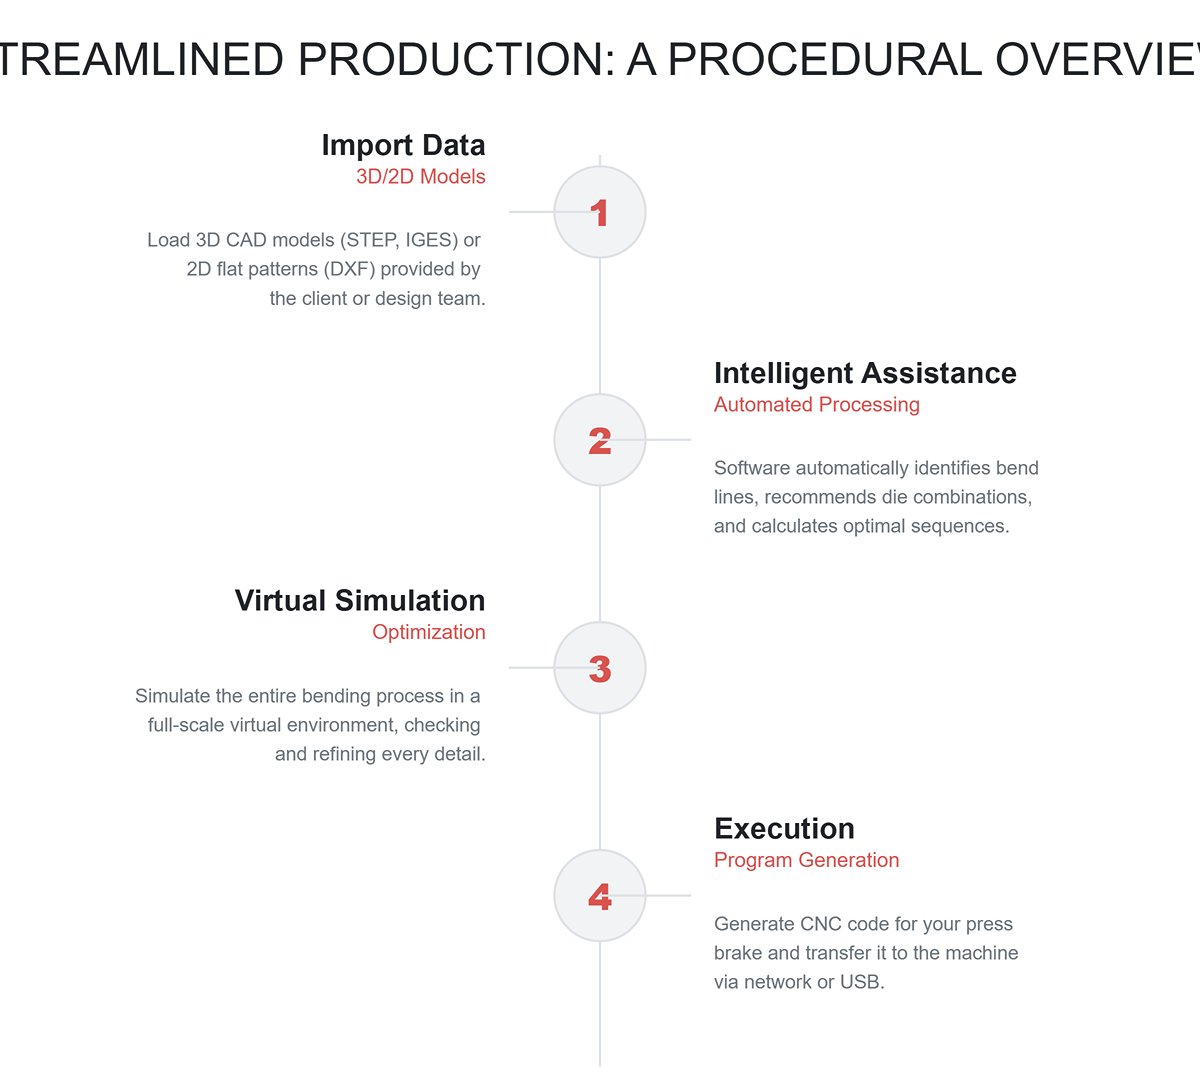
Its workflow is akin to a strategist simulating a battle on a sand table:
- Import Data (3D/2D Models): Load 3D CAD models (STEP, IGES) or 2D flat patterns (DXF) provided by the client or design team.
- Intelligent Assistance (Automated Processing): The software automatically identifies bend lines and, using its integrated die library and machine parameters, recommends the most suitable die combinations, calculates optimal bend sequences, and determines backgauge positioning strategies.
- Virtual Simulation (Optimization): Simulate the entire bending process in a full-scale virtual environment, checking and refining every detail.
- Execution (Program Generation): Once verified, generate CNC code tailored to your specific press brake brand and model, then transfer it to the machine via network or USB. The operator’s role is simply to load and run the program.
4.1.2 Bend Simulation: Rehearsing Every Step Digitally to Eliminate First-Bend Failures
This is arguably the most impressive feature of OLP. A robust simulation engine acts as your “digital crystal ball,” allowing you to foresee and resolve potential issues before touching the first sheet of metal. It enables:
- Collision Detection: Precisely model the movements of workpieces, dies, clamps, backgauges, and even the press brake frame during each bend, identifying and preventing any potential physical collisions in advance. This eliminates costly trial-and-error and collision risks entirely.
- Reachability Verification: For complex geometries, simulation confirms whether the workpiece can be correctly positioned by the backgauge, and whether flipping will cause interference with the machine.
- “Golden Sequence” Optimization: The software can automatically calculate and compare multiple bending sequences, visually presenting the one with the fewest flips, shortest movements, and fastest cycle time—maximizing theoretical performance.
4.1.3 Key Evaluation Criteria for Top-Tier OLP Software
When selecting OLP software, you’re choosing a long-term strategic partner. Pay close attention to these core value-defining features:
- Open Post-Processor Library: Can the software support all (or most) of the different brands and vintages of press brakes in your shop? A closed, single-brand-only OLP solution will limit your future equipment choices.
- True “Digital Twin” Database: The machine models and die libraries in the software must exactly match your physical assets to achieve a genuine digital twin; otherwise, simulations will be meaningless.
- Seamless Integration with Robot Programming: Expert Insight: If you plan to introduce robots in the future, choose OLP software capable of simultaneous press brake and robot path planning. This will save substantial integration time and cost, ensuring robot actions—gripping, placing, flipping—are perfectly coordinated with press brake movements, rather than functioning as isolated systems.
4.2 Robotic Press Brake Cells: When and How to Invest
Robotic automation is the cornerstone of a true 24/7 “lights-out” factory and the ultimate lever for multiplying productivity. But it’s not a cure‑all—blind investment is the biggest trap.
4.2.1 Application Scenarios: Choosing automation for high-, low-, and mixed-volume production
- Outdated perception: Robots are only suitable for ultra‑high‑volume, single‑product manufacturing, such as in the automotive industry.
- Modern reality (the rules have changed):
- Medium to large volumes, limited variety: Still the classic “sweet spot” for robotic bending. Robots can tirelessly repeat high‑intensity, high‑precision tasks with consistent quality, keeping OEE performance and quality rates steadily above 95%.
- Small batches, high variety (the new growth frontier): Expert insight: What truly makes small‑batch automation viable is the golden trio of OLP + Automatic Tool Changer (ATC) + intelligent robotics. In this disruptive workflow, engineers use OLP software during the day shift to program an entire day’s—or even week’s—worth of small‑batch jobs. The robotic cell then uses the ATC to swap upper and lower tooling in minutes, switching seamlessly to the next job. In this model, the robot is no longer a rigid, repetitive laborer but a flexible “super‑technician” capable of on‑demand task changes, generating unattended profits overnight and on weekends.
- Unsuitable scenarios: Single or artisanal pieces with extremely complex geometries, parts too large or too small for robotic handling, or work requiring frequent human judgment and fine adjustments.
4.2.2 Practical ROI Calculation Guide for Robotic Cells
Investing in robotics isn’t just a purchase—it’s a strategic decision. It demands a clear financial analysis.
ROI (years) = Total Initial Investment / (Annual Cost Savings + Annual Additional Profit)
Let’s break down this formula:
- Total Initial Investment (I): Includes the robot, compatible press brake, system integration, positioning table, custom grippers, safety fencing, OLP software, training, and all other one‑time costs. A typical cell might range from $150,000 to $300,000.
- Annual Cost Savings (S):
- Direct labor costs:
Annual salary of replaced operator × (1 + company benefits factor). Key multiplier: For multi‑shift operations, multiply savings by the number of shifts (e.g., 2 or 3). This is the strongest financial lever for making ROI highly attractive—a single robot can easily replace labor across 2–3 shifts.
- Direct labor costs:
- Annual Additional Profit (P):
- Throughput gains:
(Robot’s daily output – Manual daily output) × Profit per unit × Annual operating days. Robots don’t tire or pause, maintaining consistent cycle times. - Quality improvements:
(Previous manual scrap rate – Robotic scrap rate) × Annual output × Fully loaded cost per unit. Robots can practically drive defects to zero.
- Throughput gains:
Example: Suppose initial investment (I) is $250,000, replacing one operator in a two‑shift setup. Operator’s annual salary is $50,000 with a 25% benefits factor.
- Annual cost savings (S) =
$50,000 × 1.25 × 2 shifts= $125,000/year - Assume stable operations and quality gains add extra annual profit (P) = $45,000/year
- ROI =
$250,000 / ($125,000 + $45,000)=$250,000 / $170,000≈ 1.47 years
This means your full investment is recovered in under 18 months. After that, the automated cell becomes a profit‑generating machine that keeps paying dividends.
4.3 Material Flow Automation: Seamless Integration from Sheet Storage to Finished Goods
Once your bending cell is robotized, the next bottleneck will almost certainly be material supply and transfer. A million‑dollar automation cell that constantly waits for a forklift to deliver sheets or for someone to remove finished goods will still suffer from poor OEE utilization.
True automation maturity comes from connecting the entire shop floor’s material flow:
- Automated Storage and Retrieval System (AS/RS): Your intelligent sheet metal steward. Guided by MES commands, it can retrieve full stacks of required sheets within minutes and deliver them via conveyors directly to the laser cutter’s loading area.
- Automated Guided Vehicles (AGVs) / Autonomous Mobile Robots (AMRs): Once parts are cut, they’re auto‑stacked on pallets. AGVs—or smarter AMRs—receive the signal and transport these semi‑finished goods directly to the designated robotic bending cell’s feed table.
- Automated finished goods stacking and transfer: After bending, the robot stacks finished parts precisely onto another pallet. Once full, the system calls an AGV/AMR to move it to welding or packaging.
This creates a truly complete “Industry 4.0” landscape—where material and data flow seamlessly from raw stock to finished product. It transforms isolated “islands” of automation into a fully connected “continent” of efficiency, ultimately multiplying your production capacity.
V. Avoiding Pitfalls and Misconceptions: Keys to Successful Transformation
By now, we’ve built a comprehensive blueprint for boosting productivity—from diagnosis and optimization to automation. But even the most flawless blueprint is worthless if it can’t be executed. The “last mile” of transformation is littered with cognitive traps and managerial resistance.
This chapter will act as your navigator, helping you identify and avoid these hidden reefs so your transformation journey reaches a successful destination.
5.1 Four Common Cognitive Misconceptions
These misconceptions are like mental viruses—they erode your determination for change and steer your efforts off course.
- Misconception 1: “Technology is a silver bullet” — believing new equipment or software alone will solve all problems
- Reality: Technology is never the solution by itself—it’s a powerful amplifier. It will magnify the strengths of your existing processes, but it will just as mercilessly magnify their flaws. Drop a top‑tier automation robot into a chaotic, poorly organized workflow and you’ll only create “automated chaos,” potentially performing worse than a skilled human operator.
- Authoritative insight: The most successful automation projects often begin long before any equipment is purchased. They start with a thorough review and lean transformation of existing processes (as outlined in Chapter 3). Only when you have stable, standardized manual workflows can automation deliver multiplicative gains. Otherwise, you’ll pay a hefty “technology tax” for low process efficiency, and your ROI will fall far short of expectations.
- Misconception 2: “ROI is the only decision standard” — focusing solely on the ledger while ignoring strategy
- Reality Check: ROI measures tangible, quantifiable financial returns, but it often overlooks the equally critical strategic value that’s harder to put into numbers—yet crucial for sustaining competitiveness over the next decade.
- Quality Reputation: An automated unit capable of delivering flawless, consistent quality can earn the trust of premium customers and open doors to markets previously out of reach. How exactly would that reputation show up on a balance sheet?
- Agility and Speed to Market: Features such as offline programming and automatic die changes can enable you to respond to small-batch, customized orders several times faster than competitors. In today’s manufacturing world, where "fast fish eat slow fish," what is that capability worth?
- Talent Attraction and Retention: A modern, technology-driven, safe, and clean work environment is a powerful magnet for the new generation of industrial talent seeking innovation and growth. How would you quantify that?
- Decision Guidance: Treat ROI as an important threshold for decision-making, but let your final choice be guided by long-term strategy. Ask yourself: “What kind of company do we want to become? What type of customers do we aim to serve?”
- Misconception 3: “Automation is just about cutting headcount”—viewing employees as expenses rather than assets
- Reality Check: This is perhaps the most damaging misconception of all. If the change is perceived from the outset as a signal for layoffs, you will immediately face employee disengagement, resistance, and even covert sabotage—greatly amplifying the obstacles to transformation.
- The Right Narrative: Successful change leaders frame automation as “liberating employees from repetitive, tedious, and hazardous tasks so they can focus on more valuable, creative work.” Automation replaces tasks, not people. The company’s responsibility is to provide reskilling and upskilling opportunities, helping affected employees transition from “operators” to “technicians” who run advanced equipment, “engineers” who program systems, or “quality analysts” who interpret data.
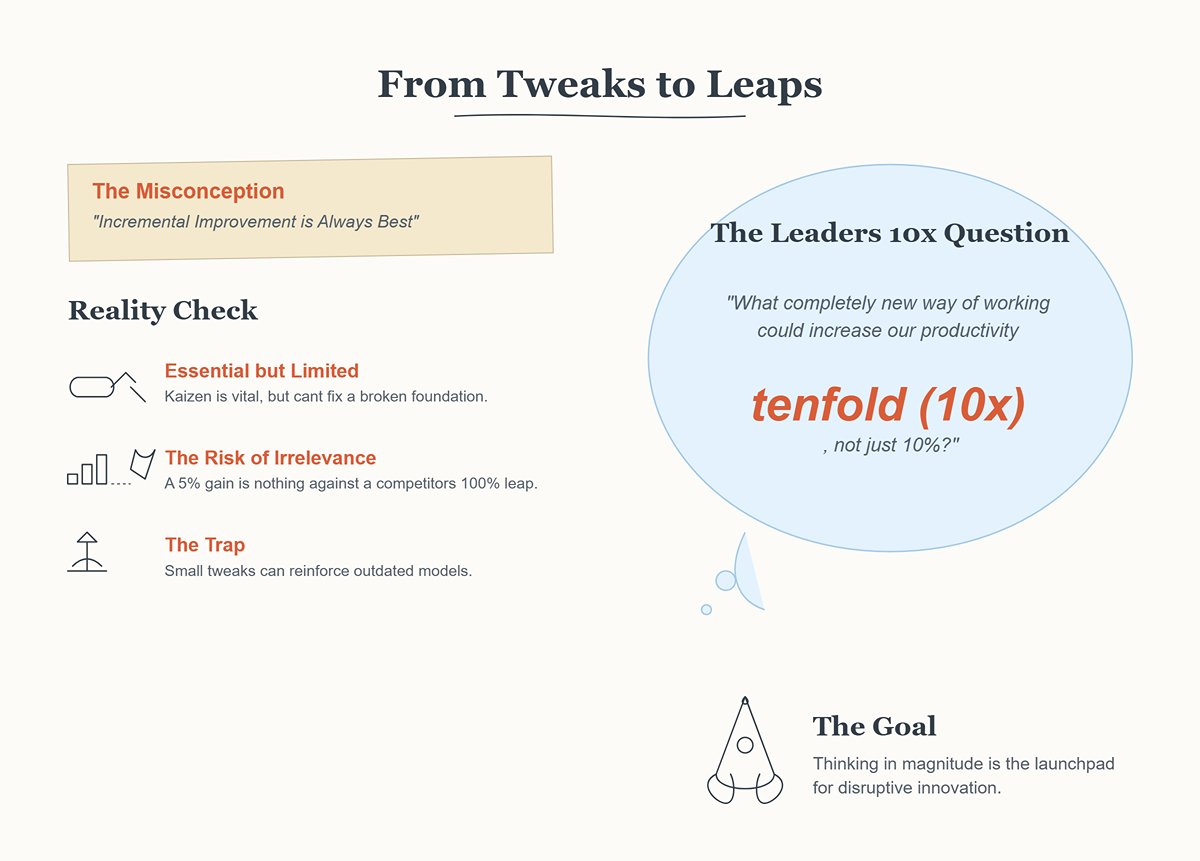
- Misconception 4: “Incremental improvement is always best”—avoiding disruptive change out of fear
- Reality Check: Continuous, incremental improvement (Kaizen) is essential for keeping an organization agile, but it sometimes cannot bridge deep structural efficiency gaps. When competitors have already doubled productivity through automation, a 5% gain from minor tweaks may be irrelevant—or worse, could entrench outdated production models.
- A Provocative Question for Leaders: Regularly ask yourself and your team: “Is there a completely new way of working that could increase our productivity tenfold—not just by 10%?” Thinking in terms of magnitude is the starting point for disruptive innovation and breakthrough growth.
5.2 Decision Barriers and Change Management
Even if you avoid cognitive traps, implementing change still faces numerous execution challenges. Effective change management requires a structured approach to overcoming resistance from both leadership and frontline teams.
- Addressing Leadership-Level Barriers: “Unwilling to invest” and “Unsure where to invest”
- Barrier: Senior management may hesitate over large upfront costs or feel uncertain about which technological options to prioritize.
- Solutions:
- Start from pain points, not technology: Don’t pitch a “robotic bending cell” right away. Instead, use OEE and KPI data (from Chapter 2) to highlight the most painful bottlenecks in your current process—such as excessive changeover times or high scrap rates—and calculate the annual financial impact of these issues. Let the data speak, reframing the investment from “an expense” to “loss prevention.”
- Offer a stepwise investment plan: Not all transformations require an all-in gamble from day one. Present a phased, low-risk roadmap. For example:
- **Phase One (3–6 months, low investment/high return):** Implement SMED and tooling carts; invest in hydraulic quick-clamp systems. - **Phase Two (6–12 months, moderate investment):** Introduce offline programming software to cut non-production time to a minimum. - **Phase Three (1–2 years, strategic investment):** Once processes are mature, deploy robotic automation cells on the most suitable production lines.- Arrange benchmarking visits: Let decision-makers see firsthand the substantial gains achieved by peers who have successfully implemented change. Real-world success stories are far more compelling than any presentation.
- Addressing Frontline Resistance: “Unwilling to change” and “Unable to change”
- Barrier: Employees may fear job loss, resist learning new skills, or cling to the comfort zone of “we’ve always done it this way,” instinctively opposing change.
- Solutions:
- Communicate, communicate, communicate: Communication is at the heart of change management. Share openly, early, and consistently the “why,” “what,” and “what it means for them” of the transformation. Be honest about challenges, and clearly outline the training and career paths the company will provide to support employee transitions.
- Involve employees from the start: Don’t present the change plan as a “final notice.” Invite experienced frontline staff and team leaders to participate in process analysis and solution design. Their practical insights are invaluable; making them co-creators rather than passive recipients can greatly reduce resistance and yield more workable solutions.
- Identify and empower “change champions”: In every team, there are open-minded early adopters eager to embrace new ideas. Spot them, prioritize their training, and let them be the first to successfully use new technology. Peer influence often proves far more persuasive than management directives.
- Celebrate small wins: Don’t wait until the entire project is done to celebrate. Recognize and reward milestones—like the first team to halve changeover time through SMED or the first employee to successfully run an offline program. These small victories build organizational confidence and momentum for change.
Ultimately, successful productivity transformation is less a technological revolution than a carefully planned and executed organizational evolution. It tests not only your technical vision, but also your leadership acumen and management skill.
VI. Conclusion
In summary, elevating press brake productivity is a strategic process, not a series of isolated fixes. It requires moving from guesswork to data-driven diagnosis with OEE, then systematically improving through the pillars of People, Machine, and Process. For a true competitive leap, embracing automation is key. This guide has laid out the roadmap from analysis to action.
Ready to implement these powerful strategies? The expert team at ADH is here to help you translate this knowledge into a tangible return on investment. We'll help you configure the right solutions to build a more productive and profitable future. Explore our range of advanced machinery in our Brochures. Contact us today for a personalized consultation.